
The Machine Nobody Makes Anymore
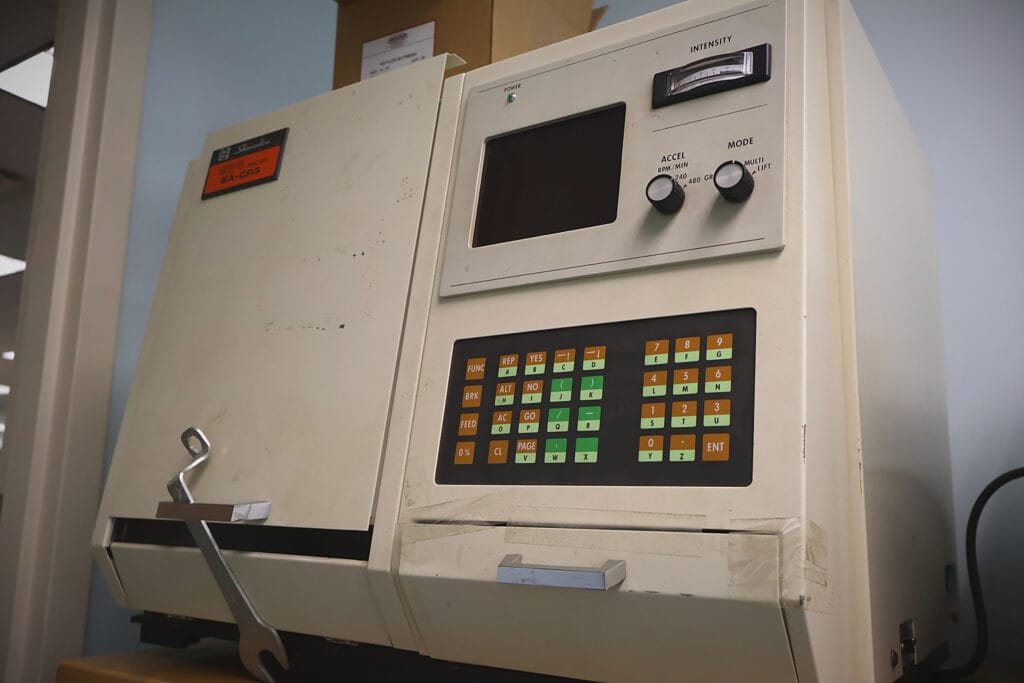
This machine is 20 years old. They probably stopped making it 15 years ago. The screen is barely readable anymore, which makes inputting the settings its own small adventure.
We use it on almost every dust sample that comes in before we design a collector.
It’s not that we haven’t looked for something newer. We have. The reason we keep coming back to this one is that it measures something most modern instruments don’t: aerodynamic particle sizing and how dust actually moves and behaves through air. Everything else is measuring something different.
Here’s the simplest way to explain why that distinction matters.
Take something flat and irregular, like a piece of tissue, a thin fibrous particle. Hold it over a 150-micron screen. Depending on its orientation, it passes right through, even though one of its dimensions is wider than the opening. So is it a 150-micron particle? Physically, maybe. But watch how it falls. It drifts. It doesn’t drop as a sphere would. Put those two particles, the flat one and the sphere, into a collector sized for one of them, and the other goes right through.
That’s the problem. We don’t really care what a particle looks like. We care how it moves through air, because that’s what determines whether our equipment captures it.
Most particle sizing equipment today is built for industries that care about consistency. A pharmaceutical manufacturer needs to know that what they made this week matches what they made last week. For that, the newer light-scattering devices are faster, cleaner, and more repeatable. They work well for that application.
The way those work: a laser shines through the sample, and you can tell by how the light diffracts which particles it’s hitting, like the atmospheric effects you see at sunset. You can make a lot of assumptions about particle count and even get some approximation of shape from the diffraction characteristics. Some labs go further and study particles under scanning electron microscopes to see exactly what they’re shaped like.
But even then, even if you say “this is a perfectly spherical particle”. Is it really? Does it have pores? Is it hollow? Does it break apart under handling? Those things all affect how it actually moves. There’s no universal correlation between physical size measurements and aerodynamic behavior. For particles that are close to spherical, the methods agree reasonably well. For everything else, physical size can be actively misleading.
There are ways to measure aerodynamics in specific contexts; stack testing equipment uses a series of tiny impingement plates or miniature cyclones to separate particles into size cuts and measure terminal velocity. But those cover a narrow range and are designed for emissions monitoring, not collector design. For the full distribution we need, across the range of materials we test, there’s really only this instrument.
Nobody really likes running these tests because they’re trickier than most, and most industries don’t need what they measure. You’re drawing a sample from process equipment, putting it in liquid, and handling it throughout, which raises the odds of operator variation and error. But for what we’re doing, there isn’t a cleaner option.
What our machine does is track how fast particles settle in liquid. That’s the core of aerodynamic particle sizing. You put a sample in, dust suspended in water, and the particles start to fall. A light beam shines through the cell and measures the change in opacity as they settle. It runs on gravity first, then kicks into centrifugal mode to get into the finer size ranges without waiting days. Before machines like this, my mentor Miczek did it by hand with glassware, tall columns, measuring at different times and depths, pulling the liquid out, drying and weighing the solids. This machine was a significant improvement.
That’s the number that matters when you’re sizing a collector. Most particle size data on spec sheets is measuring something else entirely.
There is a newer version of this instrument. A company called Micromeritics makes one called the SediGraph. It does basically the same thing, but instead of a light beam, it uses X-rays to measure settling. More high-tech, really good machine, centrifugal mode and all.
But anything that’s carbon-based, like certain plastics and organic dusts, is invisible to X-rays. Completely transparent. So for a big portion of what we test, we’d have a $50,000 machine that simply can’t see the sample. So we keep using the old one.
Running the test isn’t quick, and it isn’t simple. Getting the sample concentration right is its own challenge. Too many drops in the cell and the suspension is too opaque to read, and you have to start over. Too few and the data is thin. There’s no formula for it. You learn over time how a particular material behaves and what you’re working with.
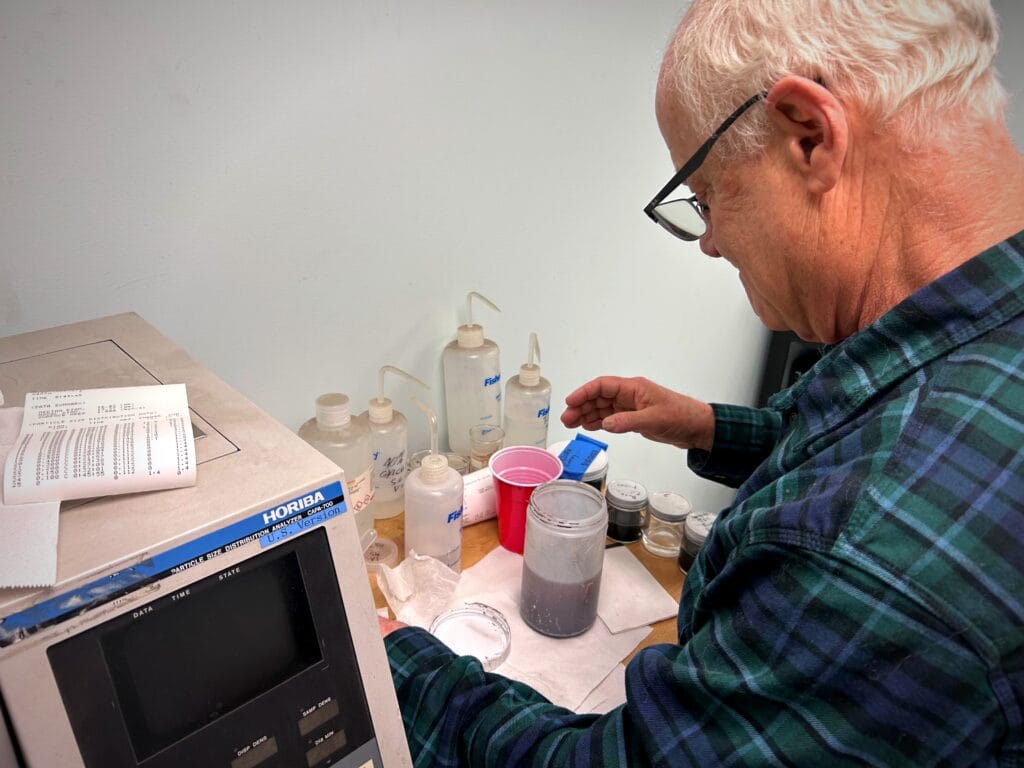
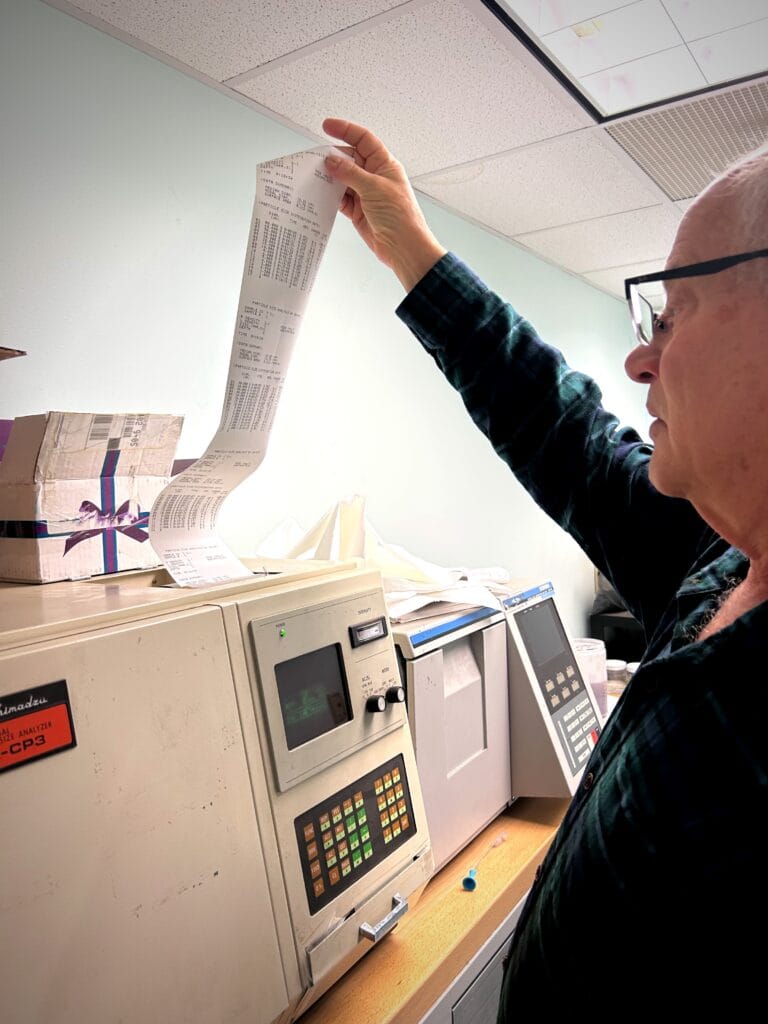
When the results come in, we’re looking at a distribution. On the fly ash we were testing recently, three runs came back at 18, 23, and 22 microns median diameter. Close enough. About 14 to 16 percent of the material was below 10 microns.
And then the real question starts: what do we do with that?
The data feeds into collection efficiency estimates, and that’s where the practical conversation happens. We can design a cyclone that captures 90 percent of this material. We can also design one that gets 95 percent. The 95 percent unit might cost twice as much.
Is the extra 5 percent worth it? That depends on how much the uncollected material is damaging downstream equipment, what the budget looks like, and honestly, how much confidence you have in every assumption that got you to that number — particle size data, process conditions, operating temperature, dust loading. Those assumptions stack up.
For the job we were testing for, the collector is going to run at 1,400 degrees. That changes the materials, which changes the cost, which changes where the break-even point is. It’s a judgment call, and getting to the right one takes a real conversation about what the actual problem is and what solving it is worth.
Someone asked what we’ll do when this machine finally gives out.
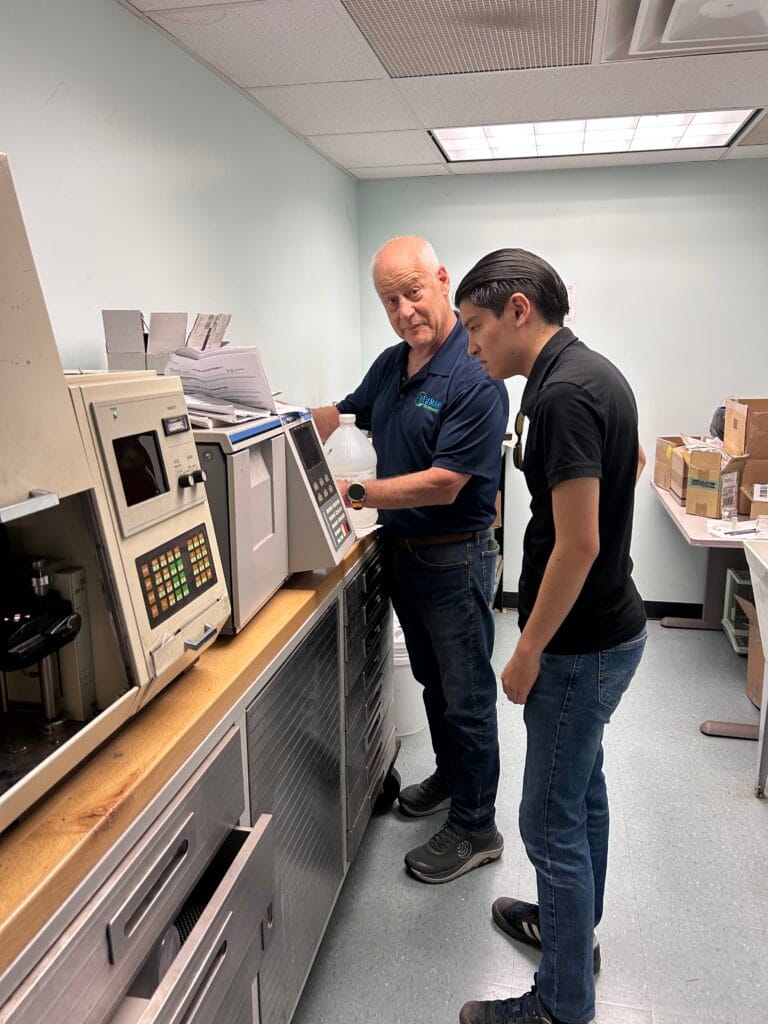
On the training side, we’re already handling it. That’s what you’re looking at in some of these images. The process and knowledge getting passed on. The judgment calls, the sample prep, knowing when the data is telling you something useful and when to just stop the run. That part’s going somewhere.
The machine itself, I don’t have a good answer for yet. There are newer instruments that come close, but nothing I’ve found covers the full range across everything we test. If you’ve run into the same problem and worked something out, I’d genuinely like to know.